The quirky signs that reveal how the economy is really doing

After years of fluctuating rates, rising prices and general economic turbulence, jargon like underlying inflation and real wage growth have become part of everyday life.
But let's be honest - these terms (and the numbers behind them) can feel dry and disconnected from reality. So, what if you could gauge the health of the economy in more interesting ways?
From Big Macs to Bunnings sausage sizzles, here are seven quirky indicators that might reveal more about consumer confidence and purchasing power than you'd expect.
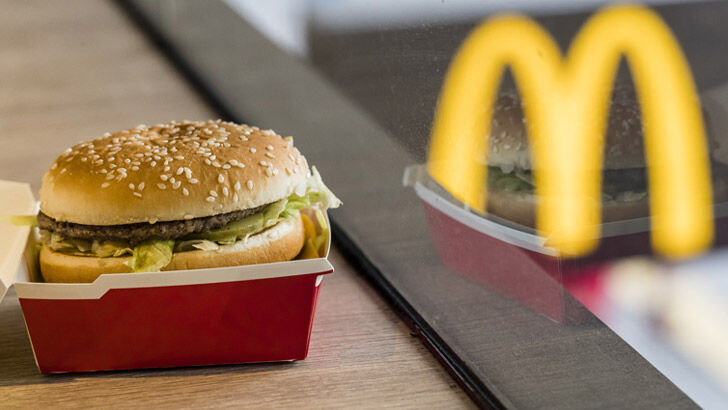
1. What is the Big Mac Index and what does it show?
What it says about the economy
Launched by The Economist in 1986, the Big Mac index started as a tongue-in-cheek way to showcase the theory of purchasing-power parity which suggests that the exchange rate between countries should equalise the price of an identical basket of goods and services over time.
Instead of a basket, The Economist simplified things using a Big Mac.
For example, the latest index shows that a Big Mac costs A$8.50 in Australia and US$6.12 in the United States.
That implies that the exchange rate is 1.39. In reality, it is 1.49 - suggesting that the Aussie dollar is undervalued by 7%.
Does it hold up?
The index has come in for criticism for being geographically limited and for the fact that Big Macs aren't uniform across the world. At the end of the day, it's a fun exercise.
2. Do falling champagne sales signal a recession?
What it says about the economy
When times are tough and consumers start to tighten the reins on their spending, logic suggests that luxury items are one of the first expenses to face the chopping block.
That's the theory behind the champagne index: that households fond of a premium bottle of bubbly might swap it out for cheaper fizz, or ditch it altogether, if a recession is looming.

Does it hold up?
Champagne might just be a worthy indicator. The Business Review at Berkley found that annual sales in the US fell from 23 million bottles before the Great Recession to 12.5 million in 2009.
There's also evidence closer to home, with indications that cost-of-living pressure has made better-value brands and local sparking more attractive to Australian champagne in recent years.
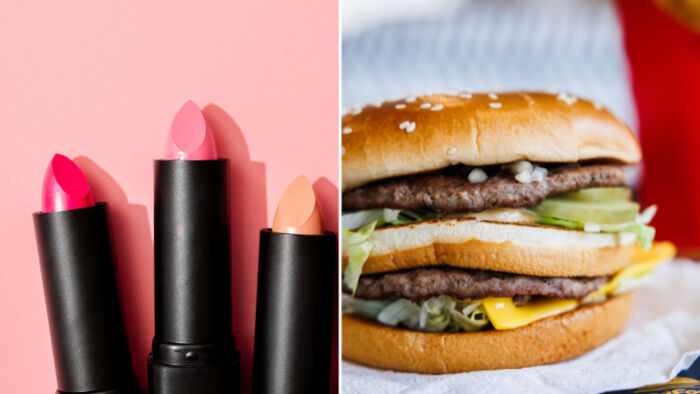
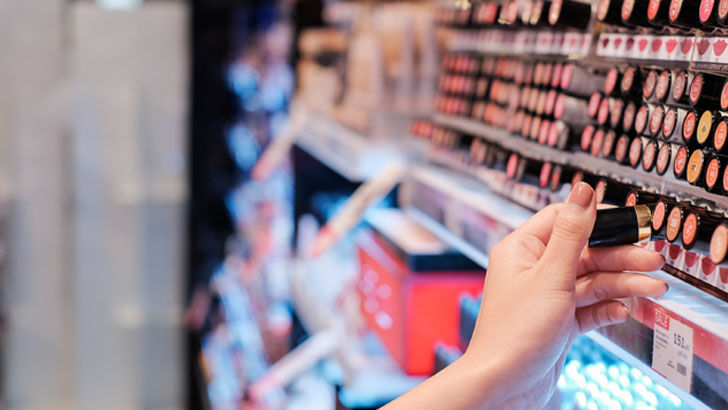
3. Can lipstick sales predict economic downturns?
What it says about the economy
Proposed by Leonard Lauder, chairman of Estee Lauder, during the early-2000s recession, the lipstick index is based on the idea that lipstick sales are inversely correlated to the state of the economy.
When people start to reduce their spending on more expensive discretionary items like clothing, the theory goes, they'll substitute those out for cheaper discretionary purchases like lipstick.
Does it hold up?
The evidence seems to be mixed. On the one hand, Lauder based the theory on an uptick in lipstick sales across the company's brands during the early 2000s recession.
However, market research firm Mintel's research on the subject during the Great Recession didn't find a link - rather, hair care and skincare were the categories where spending held up.
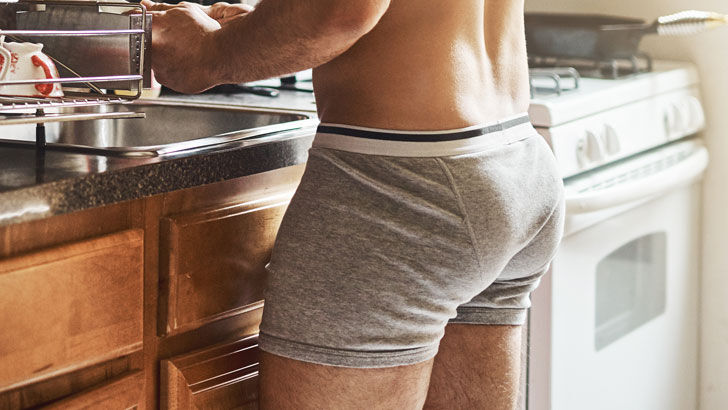
4. Why do men's underwear sales matter to economists?
What it says about the economy
Could an uptick in tighty-whities sales herald a new economic dawn? That's the thinking behind the men's underwear index theory floated by former chair of the US Federal Reserve, Alan Greenspan.
Because undies are the least-visible garment of clothing, the theory suggests they're the first item men will stop purchasing during a downturn.
But as consumer confidence picks up, they're also one of the first items men will flock to buy (or are shamed into buying once they become too holey).
Does it hold up?
Again, the evidence seems mixed. There was plenty of reporting suggesting that men's underwear sales did fall during the Great Recession.
However, an analysis published in the International Journal of Technology concluded that while the idea held up in some countries, overall, underwear sales were unrelated to the state of the economy.
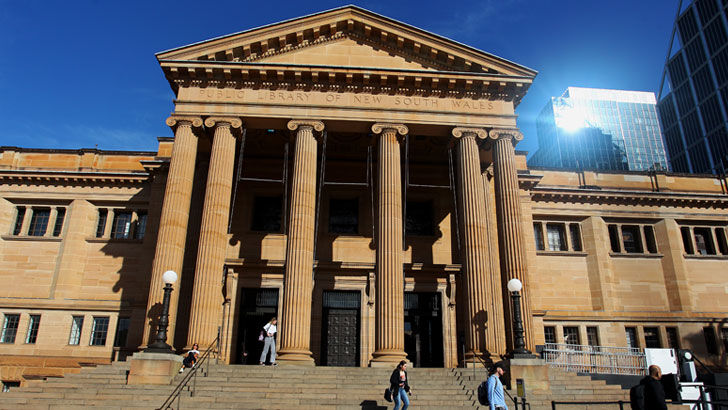
5. Do library visits rise when times are tough?
What it says about the economy
In the 1980s an American library administrator named Steven James set about determining whether there was a link between economic downturns and higher public library patronage.
He referred to it as the 'librarian's axiom'. The theory is a simple one: when money is tight, more people will turn to the free resources offered by libraries.
Does it hold up?
James himself couldn't establish a correlation using the Great Depression as an example, but other research post-Great Recession has linked downturns to greater library patronage.
In Australia, libraries also reported a surge in digital borrowing during 2024-2025 as cost-of-living pressure ramped up.
6. What is the Christmas Price Index and why is it tracked?
What it says about the economy
Since 1984, US-based PNC Financial Services Group has released a Christmas Price Index which tracks the cost of each gift in the 'The Twelve Days of Christmas' carol (i.e. twelve drummers drumming.).
Like the Consumer Price Index, this festive equivalent is simply a way to showcase changes in the price of goods and services over time.
The index shows that the cost of Christmas has risen from US$20,069 in 1984 to US$51,476 in 2025.
Unsurprisingly, soaring gold prices haven't helped, with the cost of five gold rings rising 32.5% in the last year alone.

Does it hold up?
The Christmas index has copped some criticism over the years from a few grinches for the way it calculates the price of some of the gifts involved (can you really put a dollar figure on 11 leaping lords?).
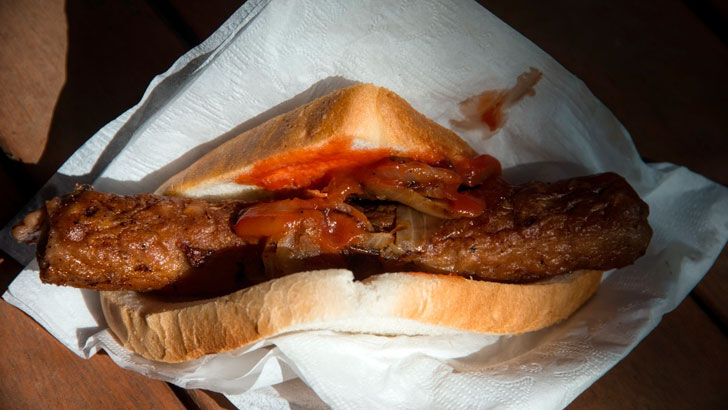
7. How does the price of a Bunnings sausage reflect inflation?
What it says about the economy
This could be the most unofficial of the unofficial economic indicators, because there hasn't been an index developed (at least, not yet).
But if there's one example of the impact inflation has had on some of our favourite goods and services in recent years, it's the price of the Bunnings sausage sizzle.
In 2022, the price of a Bunnings snag jumped from $2.50 to $3.50 thanks, in part, to rising food costs. Then in 2024, the price of a drink to go with that sausage sambo was raised from $1.50 to $2.
Of course, that money goes directly to the community groups running the sizzles, so it's not a hard cost to swallow.
Does it hold up?
The price of a snag on bread has only increased once in 15 years so it might be too early to set up a Bunnings Index.
But that gap between prices rises does just go to illustrate the extent of the inflationary environment we've been in.
Get stories like this in our newsletters.