
Investors who have no commercial property in their portfolios are missing out. There's a lot more diversity in the commercial sector compared with residential - think office towers, retail centres, huge warehouses, tourist accommodation and education ...
Search Results
Showing 161 to 170 of 227 results for chart:

Which Australian sharemarket sectors perform well after an election? The Australian sharemarket typically rallies after a federal election if you analyse the results of the last 23 elections. But what sectors do the best? Resources have historically ...

... it spent the subsequent five weeks consolidating between these two levels. This saw the formation of a bullish technical chart pattern known as a rising wedge. On April 10 the price broke through the upper bound of the consolidation band with subsequent ...

Last year was a particularly tough one at the petrol pump. According to the ACCC, prices rocketed up to 10-year highs in late October, with daily averages hitting 159.9 cents a litre in the five largest cities for base-grade petrol. "Petrol prices ...

... remain in high demand as people search for a treatment for their ailments and good quality of life. Eli Lilly share price chart A look at Eli Lilly's share price movement over the past five years shows a slow and long sideways movement from around ...

NAME: William York (pictured right) STATUS: Father of Martha, 18 months. QUESTIONS: What is the best way to set up a budget, increase my mortgage payments, establish financial goals and save? What are the savings options to fund my daughter's future ...
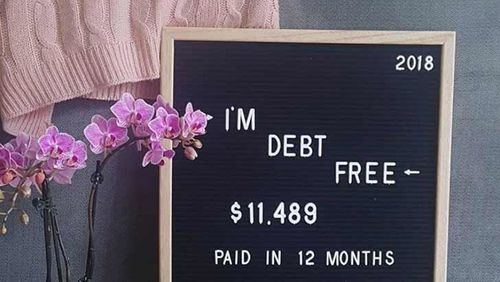
... eaten up by interest. The final countdown Photo: @tashagetsfrugal At the start of 2018 my balance was $6331 and I created a chart to track my debt. Every section that I coloured in gave me the motivation to keep going. The process was slow; every payday ...

... a particularly good example, given that the long-term business performance has been very strong, even if the share price chart looks like a mountain range viewed from the side - with plenty of valleys for good measure. Disclaimer: The author owns shares ...

... year to year. This is especially true of big-ticket deduction claims, such as car expenses, travel and self-education. 5. Chart your charitable contributions. Fortunately, doing good for others has the benefit of giving your tax refund a boost. Keep ...

If I was to give you a stock tip, what would you do? I'll tell you. You'd do what you always do - whatever that is. Everybody has their process for assessing what stock to buy and when - a habit if you like - and it is the integrity of this very individual ...