How super performed in 2025

Though there was some underperformance in parts, 2025 saw strong results overall from most super funds.
- Default MySuper products have had another stellar year returning 10.6%.
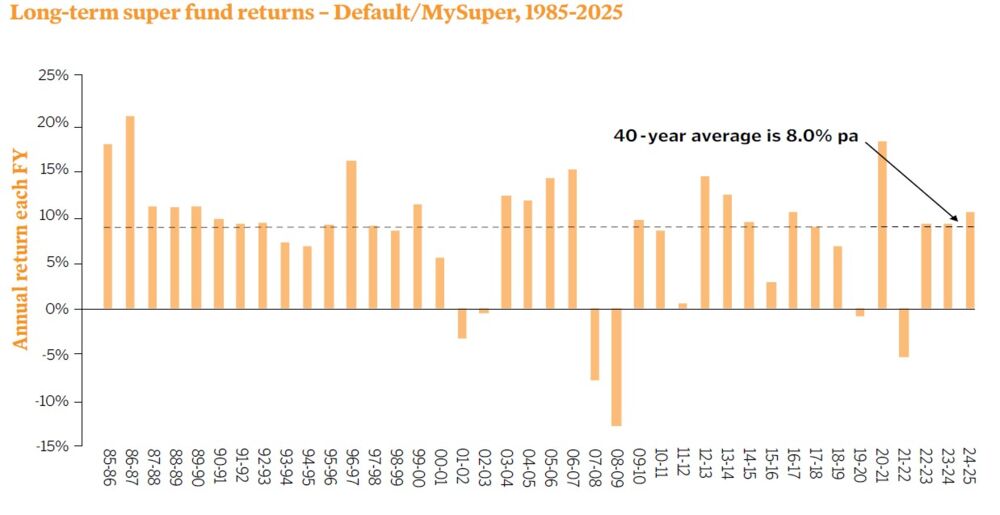
- Super funds average nearly 8%pa returns over the past 40 years.
- The best super funds achieve investment outcomes two to three times higher than those achieved by the lowest performers.
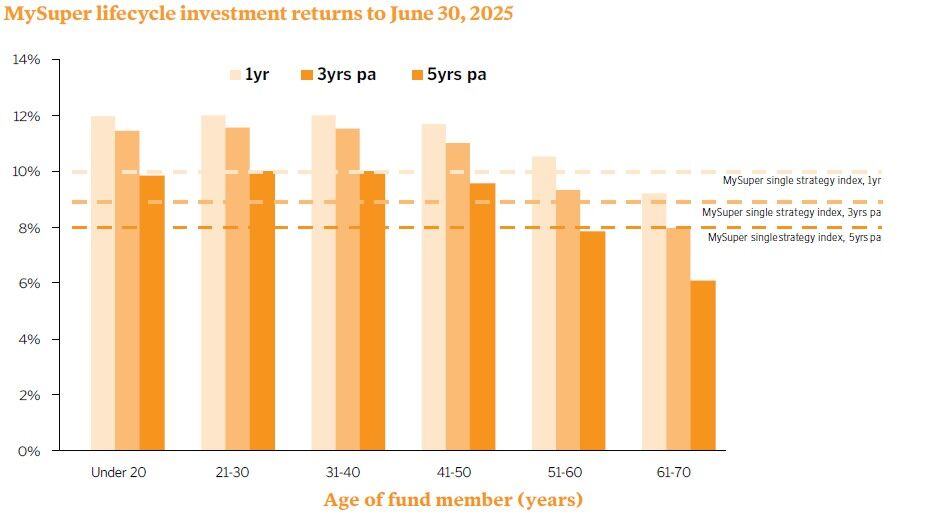
- MySuper lifecycle investment products outperformed MySuper single strategy products for younger members.
The Rainmaker MySuper investment performance index had a splendid finish to the 2025-25 financial year with an annual average return of 10.5%.
Like any other diversified investment option, the Rainmaker MySuper index's strong performance was a combined effort from all the various asset classes working their magic together. The returns were driven by strong results from Australian and international equities and positive results in Australian bonds, property, and cash.
The Australian share index delivered 13.8% in 2024-25 and international shares delivered 19.1%. The US sharemarket delivered an even better 17.4% result.
Superannuation, however, is about the long term. MySuper index returns over three years were 9.7%pa, over five years were 8.2%pa and over 10 years returns were 6.9%pa. The ultra-long-run story was 6.4%pa over 20 years, 6.9% over 30 years and 8.0%pa over 40 years.
While these figures reflect average returns across the whole superannuation industry, choosing a high performing superannuation product is still the key to securing your retirement nest egg.
Demonstrating this difference between an average fund and the highest performing fund; while members in an average fund have more than doubled their account balance in the past decade, members of the top funds would have seen their balances triple.
| PERFORMANCE TEST
In 2021, the government introduced a superannuation fund performance test. The government designed the test, which is administered by the superannuation regulator, APRA. The test was earlier limited only to MySuper products and measures the extent to which the product beats its asset class benchmarks over the past eight years. This test is now being extended to non-MySuper 'choice' investment options along with updating the asset class benchmarks used previously. |
Asset class returns
Superannuation funds invest across a mix of asset classes primarily categorised as growth or defensive, depending on whether they hold lots of equities and property or are tilted towards fixed interest bonds and cash.
The returns they achieve as a rule generally reflect the combined returns of these asset classes and how each fund mixes them together.
In the most recent financial year, every asset class recorded a positive return, and some posted a double-digit return.
The average superannuation investment option invested into Australian equities earned 12.2% in the financial year, 14.3% for international equities and 7.8% for property. The defensive asset classes weren't as strong as growth assets as Australian bonds, international bonds and cash investment options all averaged 5.5%, 5.1% and 3.9% respectively.
Comparing headline sector medians for super funds with their market indexes shows some underperformance. International equities underperformed by 4.4%, Australian equities by 1.2%, Australian fixed interest by 1.7%, and international fixed interest was largely in line with its market index.
These asset class investment outcomes mean that growth products with high exposure to equities and property achieved an average 11.9% return in 2024-25 compared to the 10.3% achieved by the average balanced product. Interestingly, capital stable products that hold a larger proportion of their assets in conservative investments like fixed interest bonds and cash achieved reasonable average returns of 8.1%.
The same pattern held up over 10 years. Growth products averaged 7.9%pa, balanced products 6.6%pa and capital stable products averaged 4.5%pa.
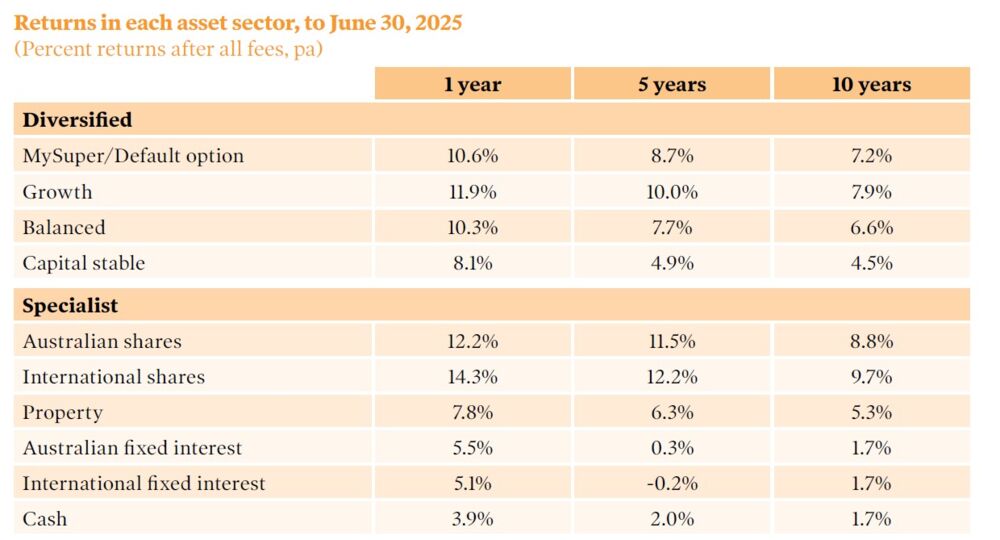
MySuper products, as expected, delivered 10-year returns of 7.2%pa that sat right between these growth and balanced sector averages.
Yet again, results like these show us why it is important to diversify your investments and focus on the medium to longer term - which is why most people hold their superannuation in a MySuper product or in a growth or balanced investment choice.
Best versus the worst
While these strong, long-term average superannuation returns are a reasonable benchmark of what members should be expecting from their superannuation fund, it is extremely important that you do not tolerate low-ranking returns, especially if they are sustained.
For example, in 2024-25, while the average MySuper product achieved 10.6%, the best achieved 13.5% and the worst achieved 7.6%. This is a range from best to worst of 5.9 percentage points.
This gap comes about because each year the best performing superannuation fund usually achieves two to three times the return of the lowest-performing superannuation fund. Viewed another way, during the past decade the average annual performance gap between the best and worst MySuper products was a staggering 8.7%pa.
This is many times greater than the range in fees between the cheapest and most expensive funds, demonstrating why remaining a member of a low-performing, that is, low-ranking, fund is much more damaging to your superannuation savings than being in a fund charging excessive fees.
Showing how this works in practice, if you were in the top-performing super fund each year for the past decade you would have averaged 10.7%pa. But if you were in the lowest-performing fund every year your 10-year return would be only 3.0%pa.
Lifecycle investment returns
Lifecycle MySuper products are those where the investment strategy is determined by the age of the fund member. As members of these products get older, they are moved into sub-options specially designed for their age group, that is, as you get older the more defensive your asset mix becomes.
The idea behind lifecycle investing is that when members are young, they have many decades until they are expected to retire and should be investing more of their superannuation in high-performing albeit higher risk assets, such as equities and property.
As they get older and approach retirement, however, their tolerance for investment risk reduces so their exposure to equities and property is wound back in favour of more defensive asset classes such as fixed interest and cash.
Lifecycle investment options for young members, with heavy allocation to equities, outperformed the regular diversified single strategy MySuper products.
While regular MySuper products earned an average 10.2%, lifecycle products for people aged under 40 years earned an average 12.2%.
For members aged 40 and above, the average MySuper lifecycle option returned 12%, mainly due to shift of asset allocation from growth to defensive, as they become more focused on preserving capital. But it is at this stage of many fund members' lives when the power of compounding comes into play.
Though every positive return adds multi-folds to members' account balances, on the flipside, it hits harder when the returns are lower than they might expect.
These lifecycle investment return results mean that even if you choose a lifecycle investment strategy for your superannuation, it is still crucial that you compare its investment returns at least once a year. You should not take a set-and-forget approach.
| Making sense of your super fund's performance |
| How MySuper has performed for members |